Historical rainfall maps
The baseline time period of 1975-2023 is used for rainfall because since the mid-1970s, rainfall in the 2 wettest months (June and July) has declined by up to 20% in the SWLD, with reductions in the number of rain days and the rainfall amounts in extreme events (Indian Ocean Climate Initiative, 2012). The decline in winter rainfall is attributed to fewer days with low pressure weather systems and the persistence of high-pressure systems (Indian Ocean Climate Initiative, 2012). Since 2000, the overall trend in rainfall is for drier seasons (decile 1-3) than wetter (decile 8-10).
Total rainfall
-
Annual: January to Decemberpdf (2.27 MB)
-
May to Octoberpdf (6.65 MB)
-
November to Marchpdf (7.5 MB)
Rainfall decile maps
-
Annual: January to Decemberpdf (2.09 MB)
-
April to Octoberpdf (7.39 MB)
-
May to Octoberpdf (7 MB)
-
May to October including information on significant climate drivers for that seasonpdf (2.19 MB)
-
November to Marchpdf (7.29 MB)
6 seasons based on the Noongar calendar
-
Birak (December to January)pdf (7.16 MB)
-
Bunuru (February to March)pdf (7.18 MB)
-
Djeran (April to May)pdf (7.04 MB)
-
Makuru (June to July)pdf (7.07 MB)
-
Djilba (August to September)pdf (7.18 MB)
-
Kambarang (October to November)pdf (7.28 MB)
Thanks to the South West Aboriginal Land and Sea Council for their support.
4 seasons based on the Gregorian calendar
-
Summer (December to February)pdf (1.95 MB)
-
Autumn (March to May)pdf (2.06 MB)
-
Winter (June to August)pdf (2.13 MB)
-
Spring (September to November)pdf (1.99 MB)
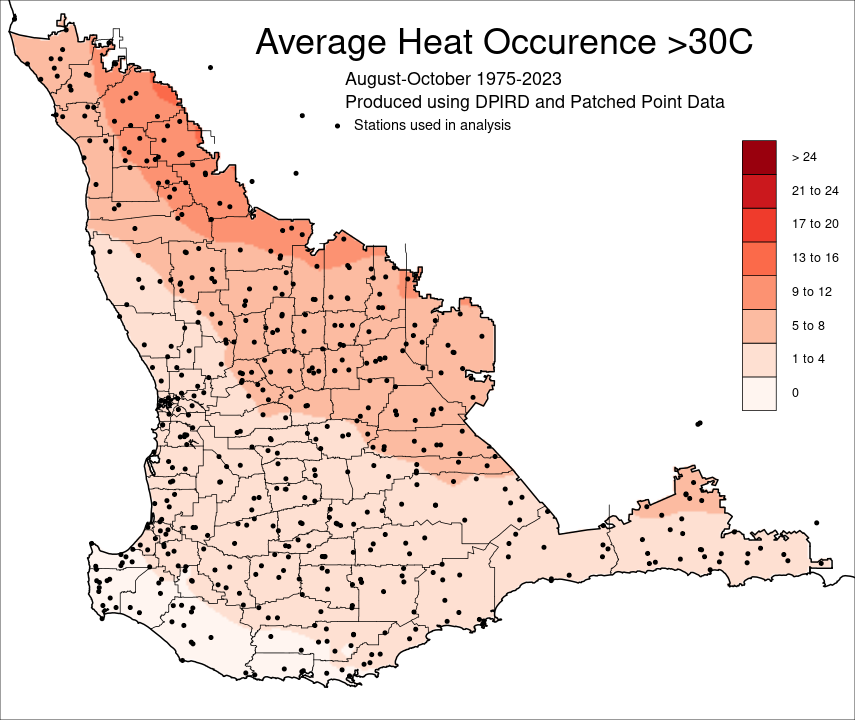
Heat severity and occurrence 1975-2023
Heat severity and occurrence maps are provided for the months August to October, 1975-2023 for the SWLD.
Heat stress (days above 30°C in August to October) is a limiting factor to crop yield and puts stress on livestock.
-
Heat severity: August to Octoberpdf (2.13 MB)
-
Heat occurrence: August to Octoberpdf (2.21 MB)
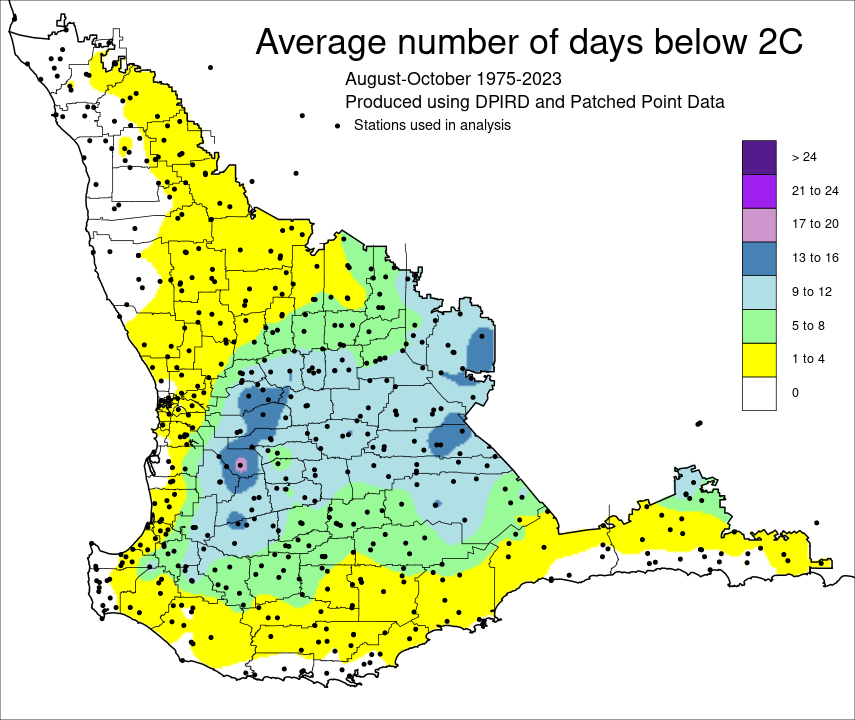
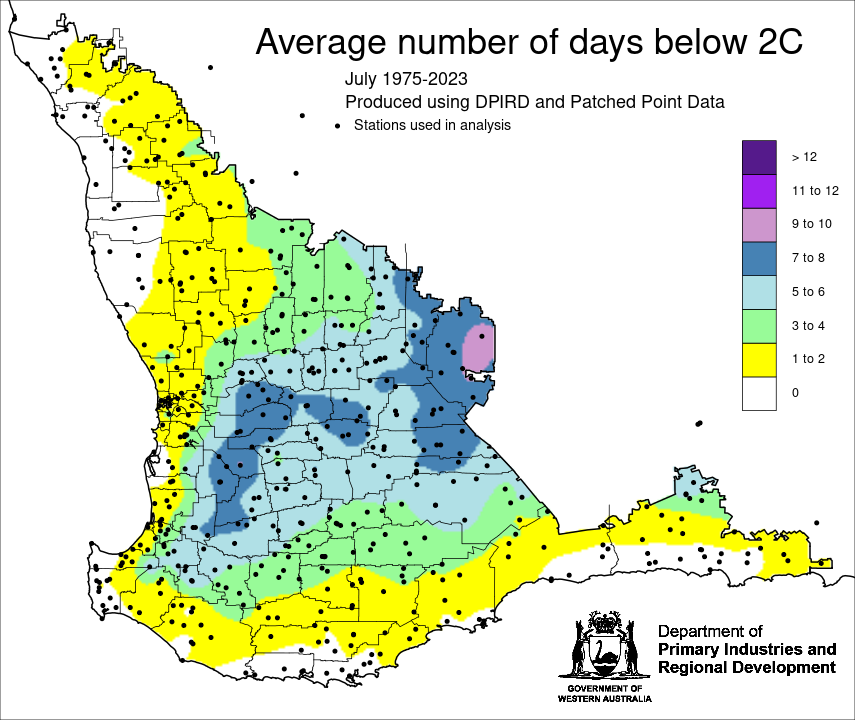
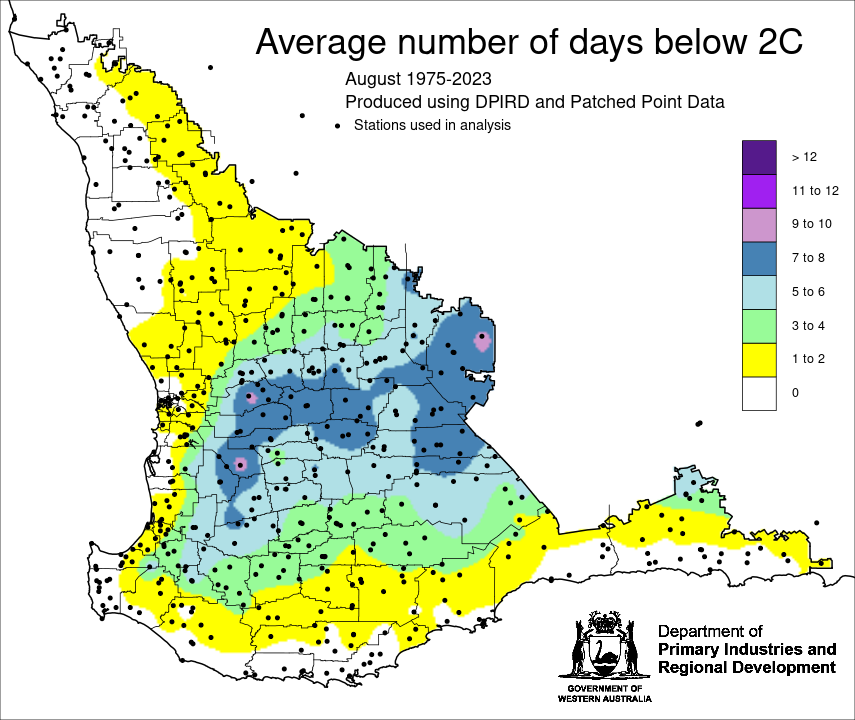
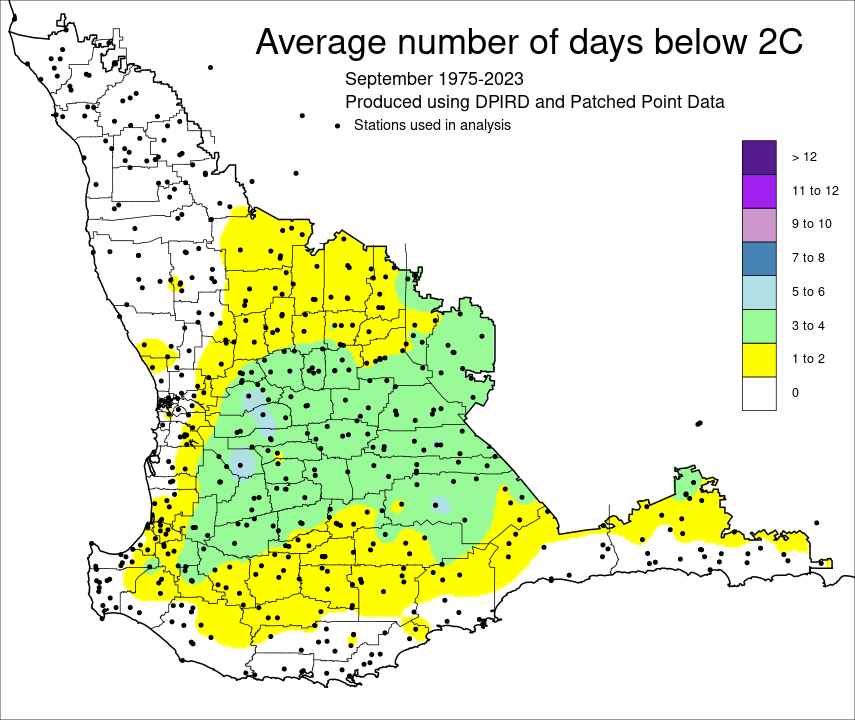
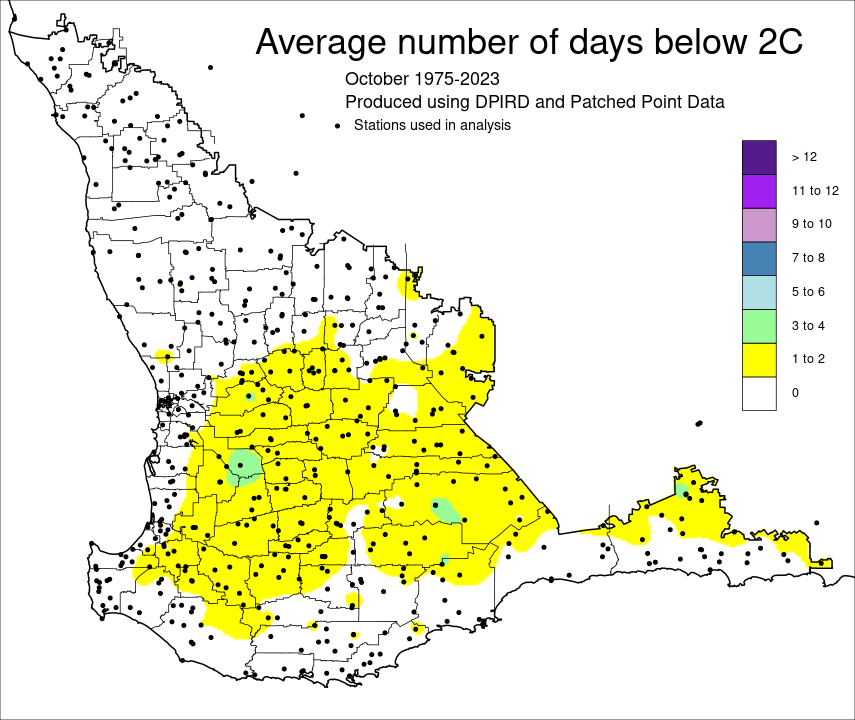
Frost severity and occurrence
The below maps detail occurrence and severity of historical frost, where the temperature recorded is below 2°C for July to October 1975-2023. Frost severity records the minimum temperature and frost occurrence records the number of days in a month or multiple months when the minimum temperature is below 2°C.
-
Frost severity: Julypdf (1.8 MB)
-
Frost occurrence: Julypdf (1.9 MB)
-
Frost severity: Augustpdf (1.85 MB)
-
Frost occurrence: Augustpdf (1.91 MB)
-
Frost severity: Septemberpdf (1.75 MB)
-
Frost occurrence: Septemberpdf (1.75 MB)
-
Frost severity: Octoberpdf (1.63 MB)
-
Frost occurrence: Octoberpdf (1.56 MB)
-
Frost severity: August to Octoberpdf (1.86 MB)
-
Frost occurrence: August to Octoberpdf (1.89 MB)
The maps below show the average number of days below 2°C for July, August, September and October for the period 1975-2023.
Related content
-
Indian Ocean Climate Initiative (2012) Milestone report 4, Project 1.2 South-west Western Australia’s regional surface climate and weather systems.
References
Indian Ocean Climate Initiative (2012) Milestone report 4, Project 1.2 south-west Western Australia’s regional surface climate and weather systems (Accessed 12 April 2024).