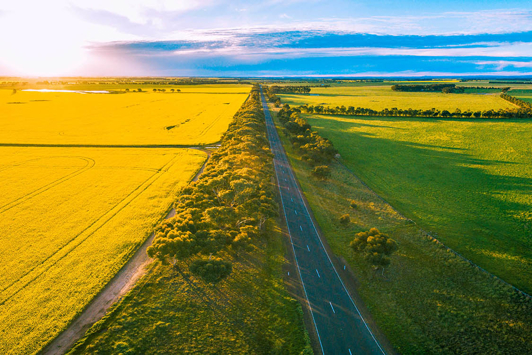
The Pastures from SpaceTM mapping tool provides weekly estimates green feed on offer (FOO) and Pasture Growth Rate (PGR) across the South West Agricultural region. This information can be used by producers to gain a property perspective of their weekly and annual pasture growth to assist in feed budgeting, supplementary feeding and land management decisions.
The tool’s primary information comes from the MODIS satellite, which passes over Western Australia (WA) at least 14 times a week at a resolution of 250 m by 250 m or 6.25 ha.
Pastures from Space™ was developed in a partnership between the Department of Primary Industries and Regional Development (DPIRD), the Commonwealth Scientific and Industrial Research Organisation (CSIRO) and Landgate. In 2019 Pastures from SpaceTM was redeveloped for WA by Landgate and DPIRD to include a zoom-in function and interactive satellite map.
Access the Pastures from Space™ application
Launch Pastures from Space™South West agricultural region
When you first open the Pastures from Space™ application, a map of the South West Agricultural region is displayed. You can choose to view either FOO or PGR. FOO is the above-ground green pasture biomass and PGR is the current rate of pasture growth.
The map will automatically default to the most recent image available (weekly) but you can change the image by clicking on the date button to access the last 6 years of weekly PGR and green FOO imagery covering the South West corner of WA.
The supplied imagery is 250m x 250m pixel data, and is created from daily satellite passes into a weekly image to minimise cloud-cover. You can zoom in and out to see how the values change across the south-west corner of Western Australia.
You can also change the opacity of the imagery which will allow you to see what satellite imagery is representing on the ground, especially when you change the base map to one of the aerial imagery options.
The vegetation (plantations and native vegetation) overlay is updated annually, however, it may not reflect current land use.
Your property
Pastures from Space™ has a charting function that allows you to select your property and generate property level summaries of FOO and PGR as the season progresses.
A chart will appear on the bottom of the screen once a property is selected. When first displayed, the chart is shown in condensed mode and displays the 'Property history' values showing the current years' data as a black line with triangular markers on it, and the previous years' data as a blue line. An additional 4 years’ worth of data is available by clicking on each of the years listed. This is the average of the property at each date.
You can toggle between FOO, PGR or cumulative PGR. The cumulative PGR option shows an estimated total pasture growth for the season by adding the weekly PGR across the year. This can be useful to identify the total production in the estimation of potential stocking rate or productivity of an area on the property (pixel function) or the whole of property potential.
The site will show the current year’s FOO alongside historical FOO curves for each year back to 2004 (to access all years, select the maximise chart symbol) allowing comparisons between seasons and showing the median (50%), 25% and 75% percentile pasture growth curves against the selected years. This allows:
- an analysis of how seasons can impact pasture growth across the property
- the trajectory or ‘shape’ of the growing season
- the total pasture grown in any year.
At a property/location level this can give a picture of likely seasonal pasture growth, particularly if years with a similar start to the season are displayed. Years can be turned on or off or all years displayed by clicking on the expanded chart button.
Note: The property summary data includes paddocks that are cropped. Cropping growth is similar to pasture in the early part of the season but as total biomass accumulates over 2,000 kg DM per ha, the ability of the satellite image to detect daily changes is limited.
Pastures from Space™ also has a pixel function which is useful to evaluate the impact of new practices, fertiliser application and new pasture establishment. This function can allow a certain area of a paddock to be queried for its pasture growth, with years that were in crop turned off for more accurate estimation of the paddocks potential production. Although the tool doesn't have the option to identify and select individual paddocks, users can zoom in on a pixel (6.25 ha) and find all historical and current pasture data for that area.
In the graph function there is an option to download the data to a csv file.
Pastures from SpaceTM estimates of FOO and PGR are based on remote sensing of 'greeness' and on-farm measurements of actual feed on offer.
The information displayed on the Pastures from SpaceTM map is supplied by MODIS (the Moderate Resolution Imaging Spectroradiometer), which is on-board both the Terra and Aqua satellites, which have been operating since 1999 and 2002 respectively (NASA MODIS). MODIS passes over WA at least 14 times a week at a resolution of 250m by 250m or 6.25 ha.
Data from MODIS allows for the calculation of the normalised difference vegetation index (NDVI), which is an index between the red and near-infrared spectral bands. The NDVI is related to the photosynthetic capacity of a canopy, which is in return related to pasture biomass. The higher the NDVI, the greater the biomass.
From these 14 images, the maximum NDVI over the week is selected for each pixel to minimise cloud and other atmospheric effects. The maximum NDVI often occurs at the end of the week, but may occur earlier in the week if cloud (including shadow) makes the image unreliable. As each pixel is independent of each other and the end product is a composite NDVI image. This composite NDVI image is then used to produce the FOO image, as well as being an input into the PGR at a scale of 6.25 ha.
The department, together with CSIRO and Landgate, conducted calibrations between the satellite NDVI and the FOO over a number of sites and years. From these measurements, a calibration was developed for Pastures from SpaceTM. The PGR was compared to measurements made on farms and the model adjusted to improve the accuracy.
The PGR uses weather information (rainfall, average maximum and minimum temperature, solar radiation) over the week. This information comes from the Bureau of Meteorology weather stations. The Bureau of Meteorology interpolates the point data to develop a 5 km square grid of weather information. The PGR was compared to measurements made on farms and the model adjusted to improve the accuracy.
The interpolated weather data is then used to determine the soil moisture and temperature plant growth indexes, which both constrain growth if not in the optimum range. Land Management units also modify the PGR and they are used to take into account differences in potential growth due to soil and topographic constraints.
The last input into the PGR is the solar radiation which also comes from the interpolated 5 km square grid. The calculation uses a coefficient as an indicator of how efficient the plant intercepts light. This coefficient does vary depending on pasture composition and soil fertility. However, as MODIS cannot detect these differences a general coefficient is used which represents a clover-grass pasture.
1. Open the Pastures from Space™ application
2. Locate your property
This can be done 3 ways:
- Look for it on the map.
Left clicking and dragging will move the map, you can zoom by using the icons in the top left of the screen or using your mouse wheel. When you have found the property you want, left click to select it.
TIP: You can change the type of map displayed by using the 'Menu' in the top right of the screen. - Search for it
Using the function on the main toolbar, enter a Property Identification Code (PIC) or Property ID. Choose the desired property from the search results to select it. - Use a bookmark.
After you have found and selected a property, you can add it as a bookmark by clicking on the icon on the main toolbar, the icon will "fill" indicating it has been added. Quickly find and select any bookmarked property by using the 'Menu'.
TIP: You can also remove unwanted bookmarks by deleting them in the 'Menu'.
Once a property is selected a thick black border represents the property boundary, and a chart is displayed at the bottom of the screen providing property history.
TIP: You can un-select a property by using the 'Menu' in the top right of the screen. You cannot have more than one property selected.
Using the charts
Charts are first presented in a condensed mode displaying 'Property history' values, with current and previous year data series active. The chart also shows percentiles calculated from all historic data available on the selected property.
TIP: You can expand or condense charts by using the icon in the chart toolbar. You can also close the chart by clicking on the close icon. To display the chart again, select your property.
Data series can be added or removed from a chart by selecting them in the chart legend, each year is displayed using a different colour. You can also hide or show the median (50%), 25% and 75% percentiles.
TIP: When you are viewing several years of historical data together, expanding the chart will help distinguish between them. To see data series older than 5 years, you will need to expand the chart.
You can also select ‘Pixel History’ on the chart toolbar and then click on a specific area of a property, a pin icon will appear on the map. The chart will update with data relevant only to that specific area (pixel) of the property.
TIP: You can see what area of a property is included in a pixel by using the PGR or FOO satellite images explained in the next help page.
Satellite imagery
PGR and green FOO satellite images of the south- west corner of Western Australia are available to overlay the map.
- Click on the PGR or FOO button in the top right of the screen to toggle a satellite image on or off, this will show you the most recent image available.
- You can select images from preceding years by using the calendar icon above the toggle buttons.
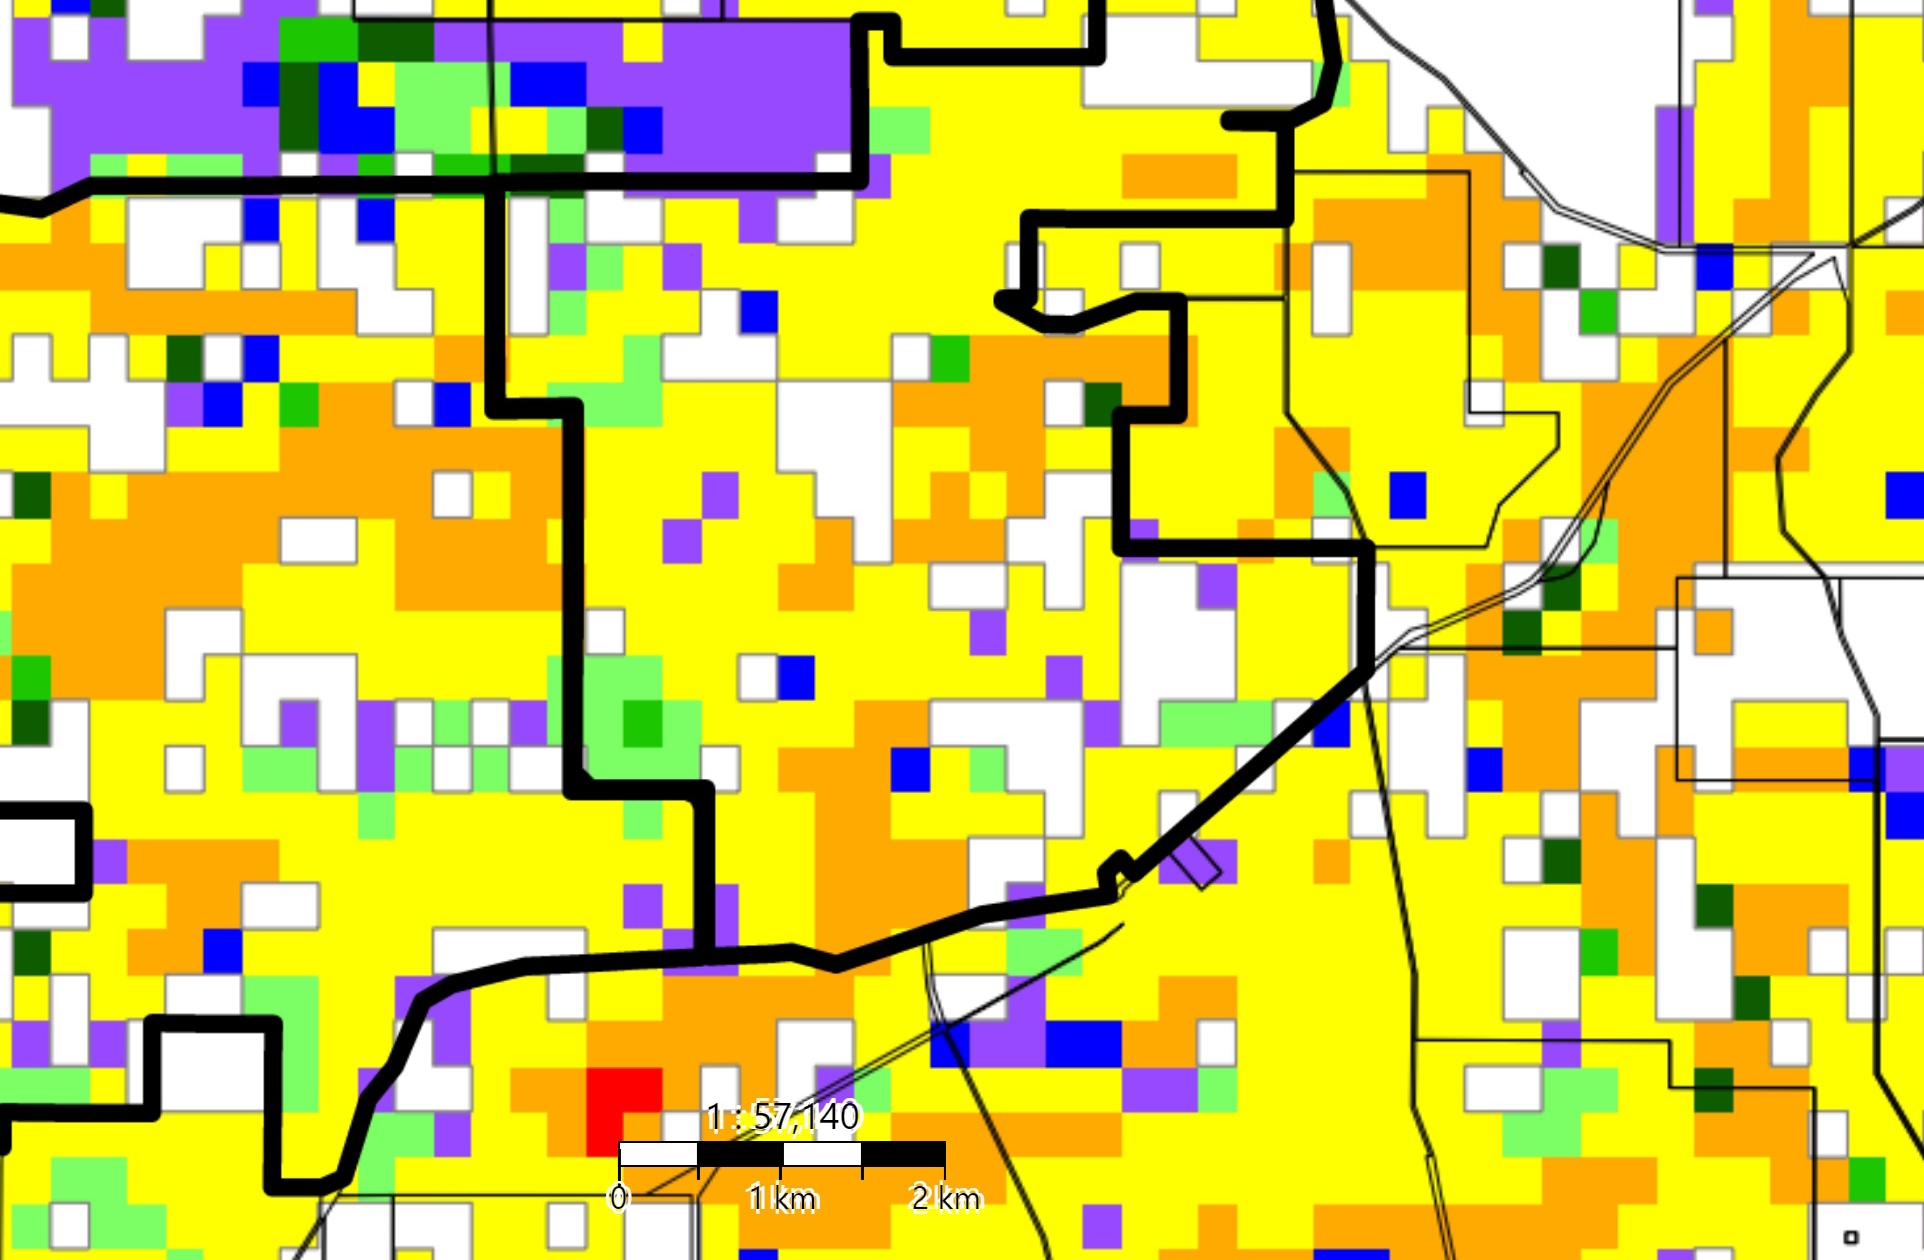
- These images also display a property’s pixels, 250 m2 areas of land.
TIP: You adjust the opacity of a PGR or FOO satellite image by using the slider next to the toggle button.
A vegetation mask is applied to PGR and FOO satellite images, removing remnant vegetation and plantations from the image. If you select a masked area of the map, the chart will not display any data.