Hydro Guide is an interactive map produced by the department used to explore surface-water flowlines and accumulation, farm dams and lakes, land surface contours and terrain slope within the south-west agricultural region.
What you will find on the interactive map:
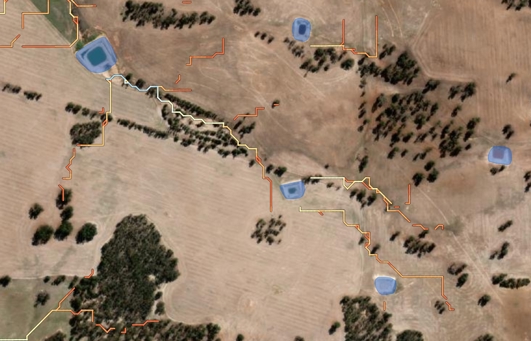
- surface water flowlines
- farm dams and lakes
- land surface contours
- terrain slope
- areas of potential inundation
- We recommend that you read the information below, then investigate the map.
- You can find your locality by using the search tab in the top left-hand corner of the map.
- You can also pan and zoom to an area of interest using the + and – buttons next to the search tab or with the wheel on your mouse.
In the top left-hand corner are:
- a locator button which will display your current position if you are using a device with an in-built GPS.
- a button allowing you to add data layers from web services or from files stored on your computer, which could include a farm plan.
- tools for converting location data to different datums, measuring distances and areas on the map, drawing on and annotating the map and printing the map window to a PDF for future reference.
In the top right-hand corner are icons for:
- legends for the layers displayed in the map – the legends will expand as you zoom in to a site.
- layers of information that can be displayed in the map – some layers will be 'greyed out' until you zoom in to the right scale.
- base maps on which the layers can be displayed – the default base map is called 'Imagery hybrid'.
The layers in the map are derived from modelling, which means that the reliability of each product is variable and will contain some errors. It is suggested this map is used as a guide and information verified using other sources.
Land surface contours and slope
Contour lines show the surface elevation in metres above sea level.
Terrain slope indicates the relative steepness of the land surface: white indicating flat terrain and black indicating steep terrain.
Potential inundation
The map shows locations likely to experience extended inundation after heavy rainfall. Blue indicates relatively low levels of inundation and red indicates relatively high levels.
Other information on the map
- This map can also display: dams with roaded catchments; rocky outcrops; dryland salinity; valley hazard (areas potentially at risk of dryland salinity).
- The 'dams with roaded catchments' layer correctly identifies the status of dams approximately 85% of the time. The main purpose of this layer is to help the department estimate the proportion of dams with roaded catchments and where they are situated to guide our support for improved water catchments.
- The rocky outcrop layer has a low accuracy and should be used with particular care. Fortunately, ground checking of this layer is simple and straight forward for users hoping to identify potential dam sites.
- All of the elevation-based layers (surface water flow, land surface contours, terrain slope and potential inundation) products were derived from mosaicked digital elevation grids of variable quality. As such the quality of the products is variable throughout the mapped area.