How to use the tool
- Enter the name of the weather station closest to your property and select it from the drop-down list.
- Select the summer start date. This is pre-set to 1 November of the year prior for the current growing season. This can be changed if, for example, a large rainfall event occurred in early November that is unlikely to affect the soil moisture status at the end of summer. In this case, you may set the summer start date to after the large rainfall to exclude that event.
- The start of summer must be before the start of the growing season. The end of summer will be automatically set as the day before the growing season starts.
- Select the growing season start and end dates by clicking on the calendar drop down menu. The growing season is usually set from 1 May to 31 October. However, some growers may find 1 April to 30 September to be more appropriate, depending on their location. Growing season start, and end dates must be within the same calendar year.
- Cumulative rainfall up to and including the forecast date (which, during the current growing season is usually set to the current date) for the current growing season is shown. After selecting the forecast date, projected decile finishes are shown.
Graphs can be downloaded and saved by clicking on the three horizontal lines to the right of the graph title.
Figure 1 shows how the deciles and current rainfall are displayed in graphs for each location. Deciles look different, depending on location. For example, decile 1 in a high rainfall zone will look very different in terms of rainfall received to decile 1 in a low rainfall zone.
The top solid green line is decile 9, which means that 90% of years in the historical data (1975 onwards) recorded less rainfall than this and 10% recorded more.
The middle solid green line is decile 5, which means that 50% of years in the historical data recorded less rainfall than this and 50% recorded more.
The bottom solid green line is decile 1, which means that 10% of years in the historical data recorded less rainfall than this and 90% recorded more.
The solid purple line is the amount of rainfall received to date for the current growing season.
Figure 1 Rainfall to date
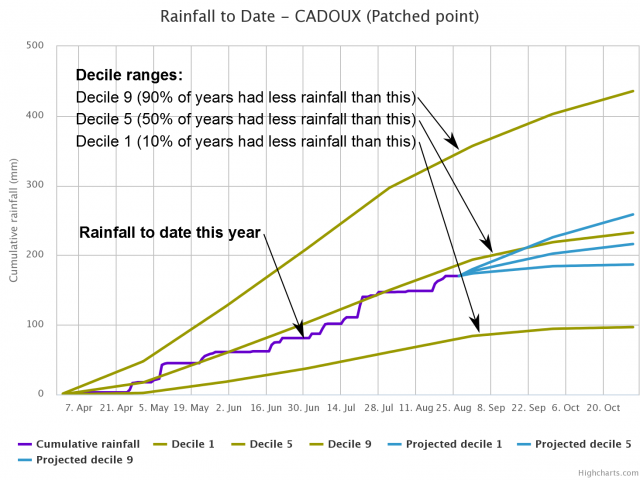
The graphs enable a comparison between rainfall received in the current season and the historical records, providing some context to how the current season is progressing.
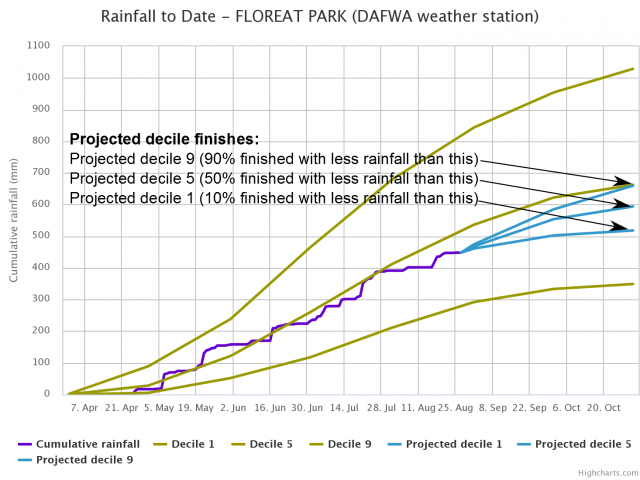
Throughout the growing season, the solid purple line will show current rainfall received. Extending out from the solid purple line are 3 blue dashed lines that represent historical finishes to a season from the current date, onwards.
The top blue dashed line is a decile 9 finish, the middle blue dashed line is a decile 5 finish, and the bottom blue dashed line is a decile 1 finish.
Figure 2 Rainfall to date, Floreat Park
Rainfall deciles
The amount of summer rainfall provides an indication of the amount of stored soil water at the start of the growing season.
Rainfall deciles are generated using data from 1975 to the year prior to the current year (inclusive), for each location.
While rainfall to date graphs can help create a narrative for the progress of a given crop and help in-season decision-making, other factors that should be considered to provide an accurate result for any given crop include:
- soil status and characteristics, including stored soil moisture, soil water-holding capacity, and any barriers to infiltration.
- stored nitrogen and other nutrient availabilities.
- factors such as non-wetting, waterlogging through topography or impermeable layers, leaching, or dispersible clays in the soil.
The timing and intensity of rain events during the growing season can influence the conversion of rainfall to biomass and yield
What is average rainfall?
Use the deciles to interpret where current rainfall sits against historical levels.
Deciles are generated using data from 1975 to 2023 (inclusive) for each location.
Rainfall deciles are calculated by ordering data from lowest to largest, separated into 10 groups of equal size.
- When referring to deciles, we can refer to them as 'well below average', 'below average', 'average', 'above average' and 'well above average'.
- Decile 1 is the lowest 10% of years on the historical record and is considered well below average.
- Deciles 2 and 3 are the lowest 20-30% of years on the historical record and are considered below average.
- Deciles 4 to 7 are the middle 40% of years on the historical record and are considered average. Decile 5 is the median (middle).
- Deciles 8 and 9 are the top 20-30% of years on the historical record and are considered above average.
- Decile 10 is the top 10% of years on the historical record and is considered well above average.
| Table 1: Rainfall decile groups and descriptive names commonly used for them in climatology. | ||
|
Decile range |
Extent of range |
Descriptive name |
|
1 |
Lowest 10% of records |
Well below average |
|
3 |
Second and third lowest 10% of records |
Below average |
|
4-7 |
Middle 40% of records |
Average |
|
8-9 |
Second and third highest 10% of records |
Above average |
|
10 |
Highest 10% of records |
Well above average |
Rainfall recordings and update schedules
DPIRD rainfall observations for any given date represent the 24 hours from 9 am, while BoM rainfall observations for any given date represent the 24 hours to 9 am.
The rainfall update schedule provides more up-to-date rainfall data, as follows:
- Rainfall data for DPIRD stations will be updated daily by 9:30 am. This will include recordings for the latest 24 hours, except for any stations that experience an outage starting prior to 9 am. In the case of data not being available for 9:30 am, further attempts to load data will be made at 3-hour intervals. Automated weather stations that have an outage that lasts longer than 24 hours will have rainfall data gaps filled by the nearest BoM patch point station data.
- Rainfall data for BoM patch point stations will be updated daily by 8:30 am, when data is available. This will include recordings for the previous day. In the case of data not being available at 8:30 am, further attempts to load data will be made by 12 pm and 4 pm. The supply of patch point data is out of the department's control. While updated data is available most business days, there are occasionally delays in the availability of this data.
Patch point data is provided by SILO (Scientific information for land owners), Queensland Department of Environment and Science, utilising BoM rainfall readings.
Rainfall data
The graphs are produced using daily rainfall data from the Queensland Government’s SILO Australian climate data set (formerly Long Paddock) and data from the Department of Primary Industries and Regional Development’s (DPIRD) Weather website.
When data for an automatic weather station in Western Australia is unavailable, data from the geographically closest SILO station is used. That is, many of the automatic weather stations only recently began recording data, so historical data from the closest SILO weather station is used to create pseudo rainfall deciles.